The diagram to the right shows the domestic demand and supply curves for a country that imports a commodity, where PW is its world price and PT is its domestic price after the imposition of a tariff. The reduction in the net national welfare of this country as a result of the tariff is best described by the area(s):
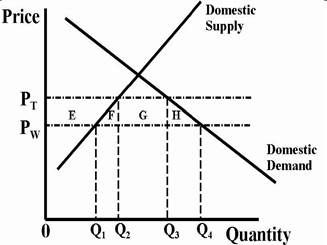
A.E.
B.G.
C.F+H.
参考答案与解析:
-
相关试题
-
A country that wishes to narrow its trade deficit devalues its currency. If domestic demand for impo
-
[单选题]A country that wishes to narrow its trade deficit devalues its currency. If
- 查看答案
-
Interestingly,many people hold the belief that imports are____ to domestic goods.
-
Interestingly,many people hold the belief that imports are____ to domestic goods
- 查看答案
-
There is [anabundant] supply of cheap labor in this country.
-
[单选题]There is [anabundant] supply of cheap labor in this country.A.a steadyB.a p
- 查看答案
-
There is [anabundant] supply of cheap labor in this country.
-
[单选题]There is [anabundant] supply of cheap labor in this country.A.a steadyB.a p
- 查看答案
-
There is [anabundant] supply of cheap labor in this country.
-
[单选题]There is [anabundant] supply of cheap labor in this country.A.a steadyB. a
- 查看答案
-
( ) is an approach to supply and demand that focuseson identifying what a customer wants and then ma
-
[单选题]( ) is an approach to supply and demand that focuseson identifying what a c
- 查看答案
-
( ) is an approach to supply and demand that focuseson identifying what a customer wants and then ma
-
[单选题]( ) is an approach to supply and demand that focuseson identifying what a c
- 查看答案
-
Driven by strong domestic demand, China remained the ______ force in clean energy investment last ye
-
Driven by strong domestic demand, China remained the ______ force in clean energ
- 查看答案
-
The aggregate demand and supply functions for the local market for pizza, along with some relevant d
-
[单选题]The aggregate demand and supply functions for the local market for pizza, a
- 查看答案
-
In the business world of today, supply is usually greater than demand. There is great competition be
-
In the business world of today, supply is usually greater than demand. There is
- 查看答案