[单选题]
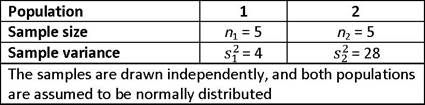
Using the above data, an analyst is trying to test the null hypothesis that the population variances are equal 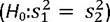 against the alternative hypothesis that the variances are not equal
 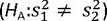 at the 5% level of significance. The table of the F-Distribution is provided below.
Table of the F-Distribution
Panel A: Critical values for right-hand tail areas equal to 0.05
Panel B: Critical values for right-hand tail areas equal to 0.025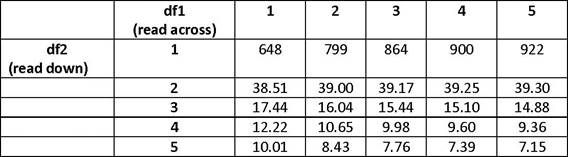
Which of the following statements is most appropriate? The critical value is:
A.6.39 and reject the null.
B.7.15 and do not reject the null.
C.9.60 and do not reject the null.