The following chart is best described as an example of which type of technical analysis chart?
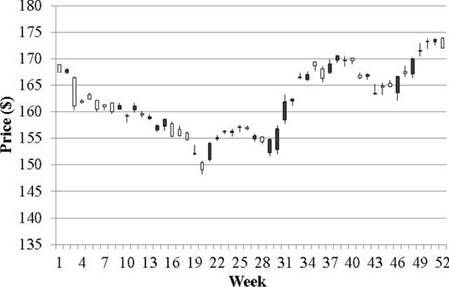
A.A candlestick chart
B.A bar chart
C.A point and figure chart
参考答案与解析:
-
相关试题
-
()is a type of bar chart that illustrate
-
[单选题]()is a type of bar chart that illustrates a project schedule. It illustrates the start and finish dates of the terminal elements and summary elements of a project.A .gantt chartB .project histogramC .milestone chartD .project flowchart
- 查看答案
-
Which type of approach can best describe the following learning pattern? <br />Students search
-
[单选题]Which type of approach can best describe the following learning pattern? St
- 查看答案
-
Which of the following statement best described the efficient frontier? It is the set of portfolios
-
[单选题]Which of the following statement best described the efficient frontier? It
- 查看答案
-
Which of the following items is best described as a listing of all the journal entries in order of t
-
[单选题]Which of the following items is best described as a listing of all the jour
- 查看答案
-
Which aid is NOT marked on a chart with a magenta circle? ()
-
Which aid is NOT marked on a chart with a magenta circle? ()A. Aero lightB. Rada
- 查看答案
-
A technical analyst has detected a price chart pattern with three segments. The left segment shows a
-
[单选题]A technical analyst has detected a price chart pattern with three segments.
- 查看答案
-
Which of the following is not the example of operating systems?
-
Which of the following is not the example of operating systems?A. WindowsB. Linu
- 查看答案
-
The notice period for a hedge fund is best described as the period following:
-
[单选题]The notice period for a hedge fund is best described as the period followin
- 查看答案
-
Which of these is the best example of an embedded option granted to bondholders?
-
[单选题]Which of these is the best example of an embedded option granted to bondhol
- 查看答案
-
Which of the following would be the best
-
[单选题]Which of the following would be the best title for the text?A. Three folding bike inventorsB. The making of a folding bikeC. Progress in folding bike designD. Ways of separating a bike wheel
- 查看答案